Kibana Tutorial
In the Managing Logs with the ELK Stack post, we have installed and configured an ELK stack to consolidate and analyze logs from an Apache Server. In this post I’ll talk a little more about Kibana and how to use it to create data charts and filter data.
Getting Started
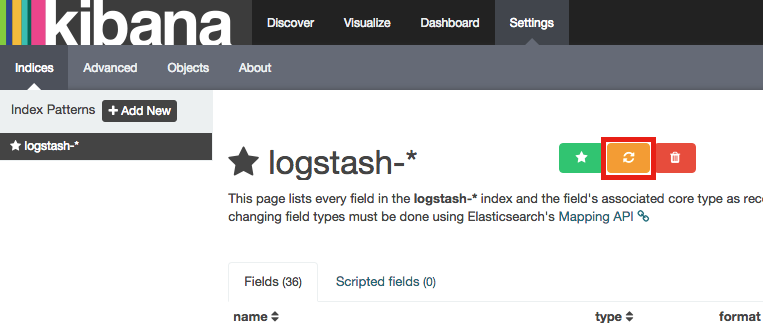
First step is reloading the fields. This step is necessary so Kibana knows that the Apache log fields are indexed and can be used for searches. To do so, go to Settings -> Indexes. In the left-hand bar you’ll see all Elasticsearch indexes Kibana will load. This allows us to restrict Kibana’s access to the analyzed indexes only. Kibana comes with the Logstash index’s name pattern by default. If it does not happen, click “Add new” and create an index with logstash-* as pattern.
To reload the fields, choose Logstash index and press the orange refresh button on the top right corner. The Apache log fields (path, request, agent etc.) should be displayed as indexed in the field list.
Let’s switch to the “Discover” tab. You will see a chart containing the amount of entries per day and the apache log entries in unparsed text. If you don’t see those, increase the analysis period on the top right corner. If logs still don’t appear, check if they are correctly loaded in Elasticsearch with the following commands:
curl 'localhost:9200/_cat/indices?v' - List all Elasticsearch indexes
curl -XGET 'localhost:9200/<nome_do_indice>/_search?' - List all entries in an index.
The index’ fields are listed in the left-hand tab. Clicking them will show a count of occurrences. You can display the selected fields only instead of log text by clicking “add”.
If you see ”This field is not indexed thus unavailable for visualization and search” ou ”unindexed fields cannot be searched” when trying to add the Apache fields you need to reload the fields
Creating Visualizations
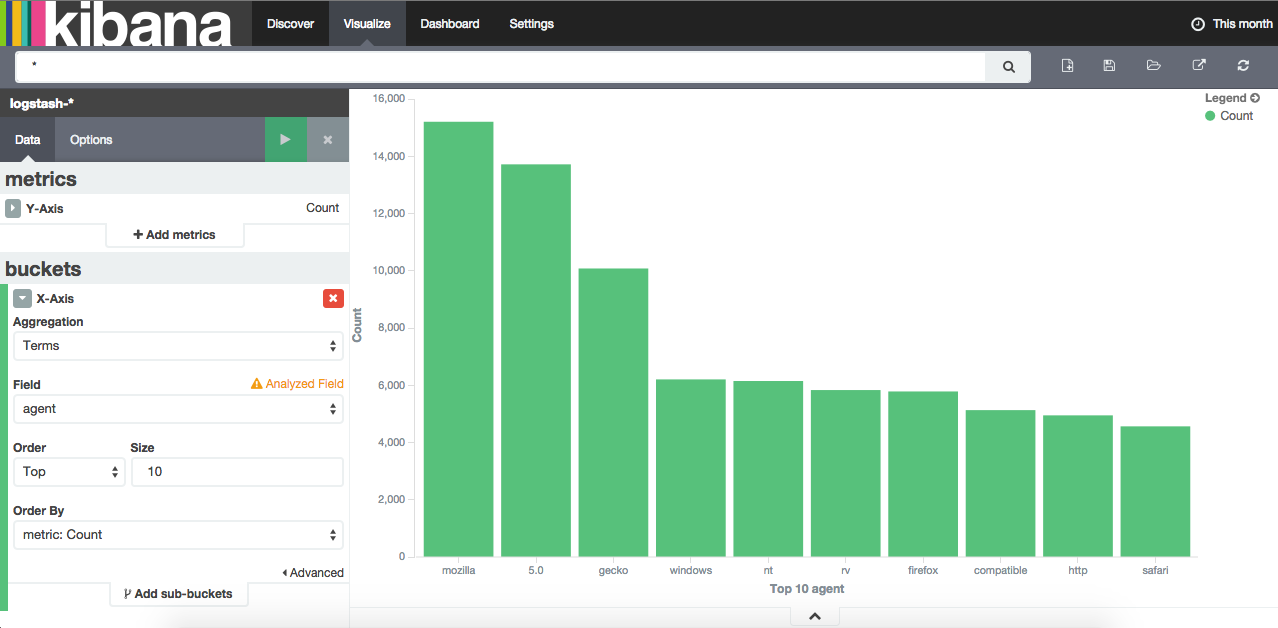
To create a vertical bar graph containing the count of every value in a field, select it and click “Visualize”:
Save the visualization by clicking the top right corner save button.
There are other forms of data visualization. In the Visualize you will see a list of possible visualizations and its use cases. Let’s create another visualization to count the errors 500 returned by the server. Select the “Metric” visualization and in the next step choose “From a new search”.
Kibana’s search syntax is the same as Elasticsearch’s (with is the same as Apache Lucene’s). The response: 500 query returns the responses with code 500. Replace * for this query. Save it in another visualization.
Creating a Dashboard
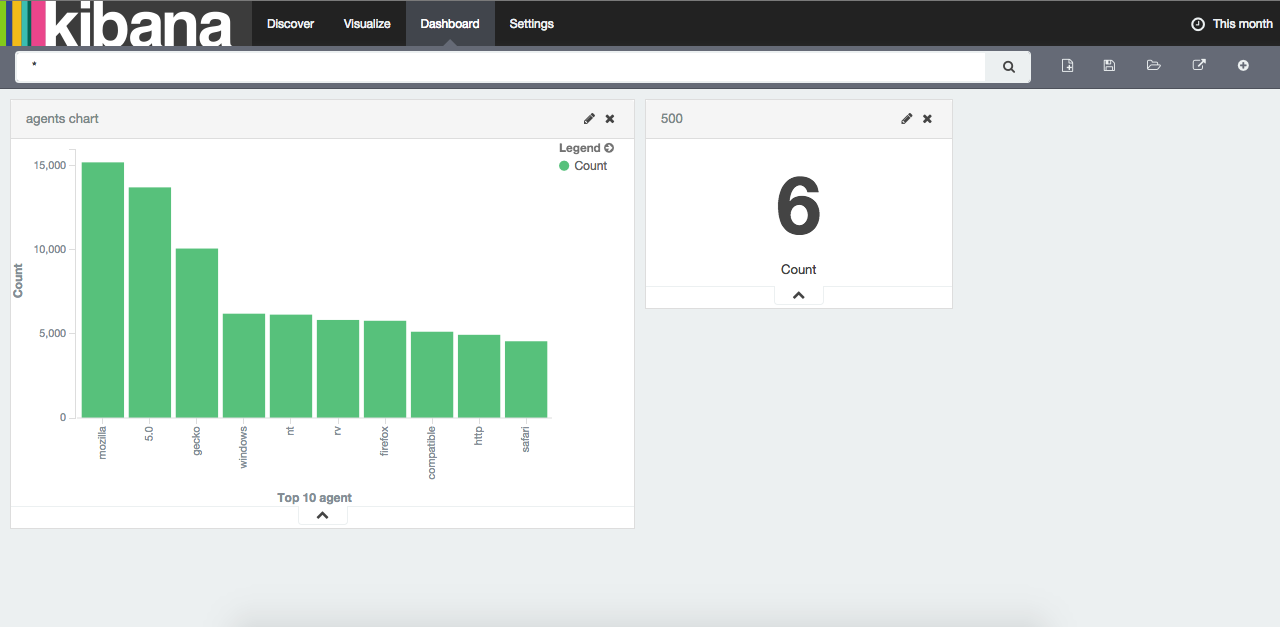
Change to the Dashboard tab. By clicking + in the top right corner, you can add visualizations to your Dashboard. They can be re-dimensioned and re-organized.
[yasr_visitor_votes size=”small”]


